今回は、Keras Conv1Dで MITの心電図の波形データセットから不整脈を検出してみます。
こんにちは cedro です。
最近、Preferred Networks は、日本メディカルAI学会公認資格「メディカルAI専門コース」のオンライン講座資料を一般公開しました。
この講座は、コードを実際に実行しながら学べるように、Google ColaboratoryのGPUマシンを使ってJupyter Notebookで動かせる仕様になっていて、無料で非常に快適な学習が進められるため、おすすめです。
ただ、Preferred Networks が作ったので当然フレームワークは Chainer です。Keras もまだ良く分かっていない私にとっては、本格的にやるのはもう少し後にしようかなと考えているところです。
そうした中、ざっと講座の内容を見たら、8章に「心電図の波形データから不整脈を検知する」という課題があり、MITの心電図の波形データセットがあることが分りました。最近、異常検知にハマっている私にとっては、これはちょっと遅いクリスマスプレゼントの様なものです(笑)。
ということで、今回は、Keras Conv1Dで MITの心電図の波形データセットから不整脈を検知してみます。
データセットを作成します
|
1 2 3 4 5 6 7 8 9 10 11 12 13 14 15 16 17 18 19 20 21 22 23 24 25 26 27 28 29 30 31 32 33 34 35 36 37 38 39 40 41 42 43 44 45 46 47 48 49 50 51 52 53 54 55 56 57 58 59 60 61 62 63 64 65 66 67 68 69 |
import os import numpy as np import wfdb # download dataset dataset_root = './dataset' download_dir = os.path.join(dataset_root, 'download') wfdb.dl_database('mitdb', dl_dir=download_dir) # setting window_size=720 # 2 seconds sample_rate = 360 # 360 Hz # list train_record_list = [ '101', '106', '108', '109', '112', '115', '116', '118', '119', '122', '124', '201', '203', '205', '207', '208', '209', '215', '220', '223', '230' ] test_record_list = [ '100', '103', '105', '111', '113', '117', '121', '123', '200', '210', '212', '213', '214', '219', '221', '222', '228', '231', '232', '233', '234' ] # annotation labels = ['N', 'V'] valid_symbols = ['N', 'L', 'R', 'e', 'j', 'V', 'E'] label_map = {'N': 'N', 'L': 'N', 'R': 'N', 'e': 'N', 'j': 'N','V': 'V', 'E': 'V'} def _load_data(base_record, channel=0): record_name = os.path.join(download_dir, str(base_record)) # read dat file signals, fields = wfdb.rdsamp(record_name) assert fields['fs'] == sample_rate # read annotation file annotation = wfdb.rdann(record_name, 'atr') symbols = annotation.symbol positions = annotation.sample return signals[:, channel], symbols, positions def _segment_data(signal, symbols, positions): X, y = [], [] sig_len = len(signal) for i in range(len(symbols)): start = positions[i] - window_size // 2 end = positions[i] + window_size // 2 if symbols[i] in valid_symbols and start >= 0 and end <= sig_len: segment = signal[start:end] assert len(segment) == window_size, "Invalid length" X.append(segment) y.append(labels.index(label_map[symbols[i]])) return np.array(X), np.array(y) def preprocess_dataset(record_list, mode): Xs, ys = [], [] save_dir = os.path.join(dataset_root) for i in range(len(record_list)): signal, symbols, positions = _load_data(record_list[i]) signal = (signal - np.mean(signal)) / np.std(signal) X, y = _segment_data(signal, symbols, positions) Xs.append(X) ys.append(y) os.makedirs(save_dir, exist_ok=True) np.save(os.path.join(save_dir, "x_"+str(mode)+".npy"), np.vstack(Xs)) np.save(os.path.join(save_dir, "y_"+str(mode)+".npy"), np.concatenate(ys)) preprocess_dataset(train_record_list, "train") preprocess_dataset(test_record_list, "test") |
まず、WFDB ライブラリーを pip install wfdb でイントールします。このWFDBライブラリーは、MITの生理学的信号の記録を閲覧、分析、作成するためのもので、MITが過去20年間に渡って収集したデータにアクセスできます。さすが、MIT!
ダウンロードするのは、波形ファイル(dat)、属性ファイル(atr)、位置ファイル(hea)の3種類×各48個=144個です。そして、属性ファイルと位置ファイルの情報を元に、波形ファイルを2秒間隔で切り取り、正常か異常に分類してデータセットを作成します。
7-9行目はデータのダウンロード、12−13行目は波形データの切り取り間隔の指定、16-22行目は学習・テストに使用するファイルの指定、26-28行目はどの属性を正常・異常とするかの指定です。
30-39行目はファイルを読み込む関数、41−52行目は波形データを2秒間隔で切り取る関数、54-65行目は他の2つの関数と連携して作成したデータを保管する関数です。
このコードを dataset.py という名前で適切なフォルダー(egc_anomalyとしました)に保存して、実行します。

MITのサーバーとやり取りしてファイル(トータル94MB)をダウンロードするので少々時間が掛かります。Finished downloading files と表示されればOKです。
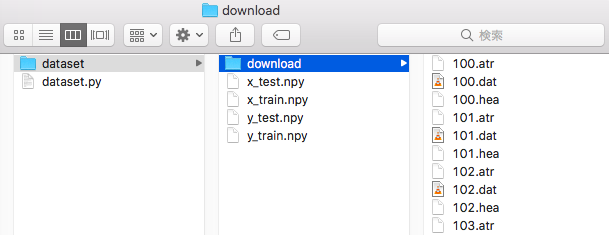
コード実行後はこんな形になります。一番左がecg_anomaly フォルダーの中で、dataset フォルダーが出来ています。
dataset フォルダーの下に、前処理を行なった x_test.npy, x_train.npy, y_train.npy, y_test.npy と4つのnumpy 形式のデータセットが出来ています。
ちなみに、dataset / download フォルダーの下にあるのは、MITからダウンロードした生データです。
データセットの内容を見てみます
まず、予備知識として心電図のデータ波形の基本について見てみましょう。
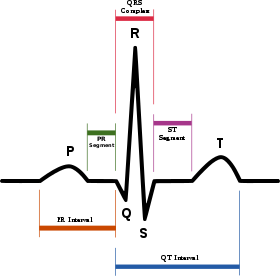
これは、心電図の波形データの模式図(出典:Wikipedia)です。P波は心房の興奮(収縮)、QRS波は心室の興奮(収縮)、T波は心室の回復(拡張)を表しています。
この波形データがどの範囲であれば正常で、どこからが異常なのかを経験豊かな専門家が読み解くのが診断です。今回は、この診断をニューラルネットワークにやらせようと言うことです。
データセットの作成に当たっては、中央にあるQRS波のRのピークを中心として、前後1秒づつ合計2秒間を1つのデータにしています。
|
1 2 3 4 5 6 7 8 9 10 11 12 13 14 15 16 17 18 19 20 21 22 23 24 25 26 27 28 29 30 31 32 33 34 35 36 37 38 39 40 41 42 43 44 45 46 |
import numpy as np import matplotlib.pyplot as plt # read dataset x_train = np.load('dataset/x_train.npy') x_test = np.load('dataset/x_test.npy') y_train = np.load('dataset/y_train.npy') y_test = np.load('dataset/y_test.npy') # 正常画像の表示 # y_train == 0(正常)の場合の idx_nを取得 idx_n = np.where(y_train == 0)[0] # x_trainの idx_n の最初を表示する plt.plot(x_train[idx_n[0]]) plt.title('normal signal') plt.xlabel('time (360/sec)') plt.ylabel('signal strength') plt.show() # 異常画像の表示 # y_train == 1(異常)の場合の idx_nを取得 idx_s = np.where(y_train == 1)[0] # x_trainの idx_n の最初を表示する plt.plot(x_train[idx_s[0]]) plt.title('anomaly signal') plt.xlabel('time (360/sec)') plt.ylabel('signal strength') plt.show() # train data detail print('X_train.shape =', x_train.shape) print('y_train.shape =', y_train.shape) # count each labels uniq_train, counts_train = np.unique(y_train, return_counts=True) print("y_train count each labels: ", dict(zip(uniq_train, counts_train))) print() # test data detail print('X_test.shape =', x_test.shape) print('y_test.shape =', y_test.shape) # count each labels uniq_test, counts_test = np.unique(y_test, return_counts=True) print("y_test count each labels: ", dict(zip(uniq_test, counts_test))) |
データセットの内容を見るコードです。
13-29行目は波形データを可視化する部分です。y_trainのラベルが0なら正常、1なら異常なので、それに該当するx_train を選択します。x_trainの1つのデータは720個の数値が並んでいるだけなので、並びを時間軸(Time)に、数値を信号の強さ(Signal strength)にしてグラフ化します。
32-45行目は学習・テストデータのシェイプや正常の個数と異常の個数を表示する部分です。このコードにdataset_disp.py という名前を付けてecg_anomaly フォルダーに保存し、実行します。
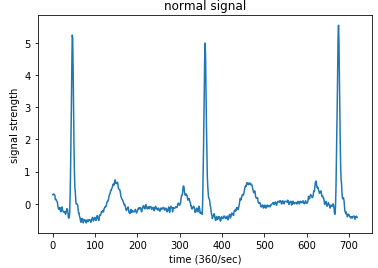
正常な波形サンプルです。横軸が時間で最大値は720(2秒間)、縦軸がシグナルの強さです。確かに、先程見た模式図と似ていますね。
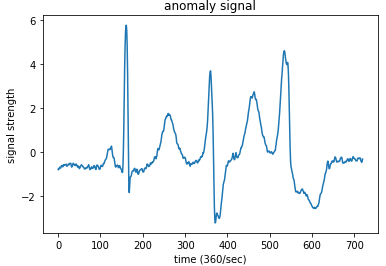
異常な波形サンプルです。P波、T波が大きく、QRS波の中のS波が大きく落ち込んでいて、模式図とは異なっていることが分かります。

データのシェイプと数に関する情報です。学習データは47738個で、その内正常データは43995個、異常データは3743個です。テストデータは45349個で、その内正常データは42149個、異常データは3200個です。
|
1 2 3 4 5 6 7 8 9 10 11 12 13 14 15 16 17 18 19 20 21 22 23 24 25 26 27 28 29 30 31 32 33 34 35 36 37 38 39 40 41 42 43 44 45 46 47 48 49 50 51 52 53 54 55 56 57 58 59 60 61 62 63 64 65 66 67 68 69 70 71 72 73 74 75 76 77 78 79 80 81 82 83 84 85 86 87 88 89 90 91 92 93 94 95 96 97 98 99 |
from keras.models import Sequential from keras.layers import Dense, Activation, Flatten, Convolution1D, Dropout from keras.optimizers import SGD from keras.utils import np_utils from sklearn.model_selection import train_test_split import numpy as np x_train = np.load('dataset/x_train.npy') x_test = np.load('dataset/x_test.npy') y_train = np.load('dataset/y_train.npy') y_test = np.load('dataset/y_test.npy') # train dataset を20%にダイエット(勿体無いですが) x_train, x_test, y_train, y_test = train_test_split(x_train, y_train, test_size=0.8, random_state=42) # train dataset の80%を学習データに、20%をテストデータに使う x_train, x_test, y_train, y_test = train_test_split(x_train, y_train, test_size=0.2, random_state=101) # 学習データの 20%をValidation data として使用 x_train, x_val, y_train, y_val = train_test_split(x_train, y_train, test_size=0.2, random_state=101) x_train = x_train.reshape(x_train.shape[0],x_train.shape[1],1) x_test = x_test.reshape(x_test.shape[0],x_test.shape[1],1) x_val = x_val.reshape(x_val.shape[0],x_val.shape[1],1) print(x_train.shape, x_test.shape, x_val.shape) print(y_train.shape, y_test.shape, y_val.shape) nb_class = 2 nb_features = 720 model = Sequential() model.add(Convolution1D(nb_filter=64, filter_length=1, input_shape=(nb_features,1))) model.add(Activation('relu')) model.add(Flatten()) model.add(Dropout(0.4)) model.add(Dense(256, activation='relu')) model.add(Dense(128, activation='relu')) model.add(Dense(nb_class)) model.add(Activation('softmax')) model.summary() y_train = np_utils.to_categorical(y_train, nb_class) y_test = np_utils.to_categorical(y_test, nb_class) y_val = np_utils.to_categorical(y_val, nb_class) sgd = SGD(lr=0.01, nesterov=True, decay=1e-6, momentum=0.9) model.compile(loss='categorical_crossentropy',optimizer=sgd,metrics=['accuracy']) nb_epoch = 5 history = model.fit(x_train, y_train, nb_epoch=nb_epoch, validation_data=(x_val, y_val), batch_size=16) score = model.evaluate(x_test, y_test, batch_size=16) print('test_acc =',score[1]) ### Plot accuracy and loss import matplotlib.pyplot as plt acc = history.history["acc"] val_acc = history.history["val_acc"] loss = history.history["loss"] val_loss = history.history["val_loss"] epochs = range(1, len(acc) + 1) #plot accuracy plt.plot(epochs, acc, "bo", label = "Training acc" ) plt.plot(epochs, val_acc, "b", label = "Validation acc") plt.title("Training and Validation accuracy") plt.legend() plt.savefig("acc.png") plt.close() #plot loss plt.plot(epochs, loss, "bo", label = "Training loss" ) plt.plot(epochs, val_loss, "b", label = "Validation loss") plt.title("Training and Validation loss") plt.legend() plt.savefig("loss.png") plt.close() ### plot Confusion Matrix import pandas as pd import seaborn as sn from sklearn.metrics import confusion_matrix def print_cmx(y_true, y_pred): labels = sorted(list(set(y_true))) cmx_data = confusion_matrix(y_true, y_pred, labels=labels) df_cmx = pd.DataFrame(cmx_data, index=labels, columns=labels) plt.figure(figsize = (5,5)) sn.heatmap(df_cmx, annot=True, fmt="d", square="True") ### ヒートマップの表示仕様 plt.title("Confusion Matrix") plt.xlabel("predict_classes") plt.ylabel("true_classes") plt.savefig("c_matrix.png") plt.close() predict_classes = model.predict_classes(x_test[1:10000,], batch_size=32) ### 予測したラベルを取得 true_classes = np.argmax(y_test[1:10000],1) ### 実際のラベルを取得 print(confusion_matrix(true_classes, predict_classes)) print_cmx(true_classes, predict_classes) |
心電図の波形データを正常か異常か学習・判定するコードです。
今回のデータセットはかなり量があるので、CPUで軽く動く様にデータセットをダイエットしています(勿体ないですが)。
x_trainを20%にダイエットし、その80%(7637個)を学習データ、20%(1910個)をテストデータに使用しています。学習データはさらに、6109個を本当の学習に、1528個をバリデーションに分けて使っています。
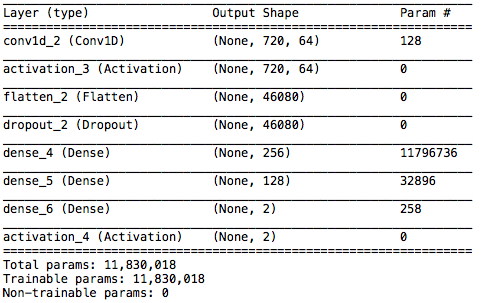
ネットワークSummary です。最初に、CONV1Dという1次元の畳み込みを使い、その後全結合層を3つ繋いでいます。畳み込みで良く使うのは2次元ですが、今回は1次元の時系列データなので、1次元の畳み込みを使っています。
53-74行目は精度とロスの推移グラフを描く部分、77-98行目はConfusion Matrix を描く部分です。train.py の名前を付けてecg_anmaly フォルダーに保存し、実行します。
データの量を抑えたのでMacbookAirで軽快に動き、 50sec / epochで、5epochが4分ちょっとで完了します。
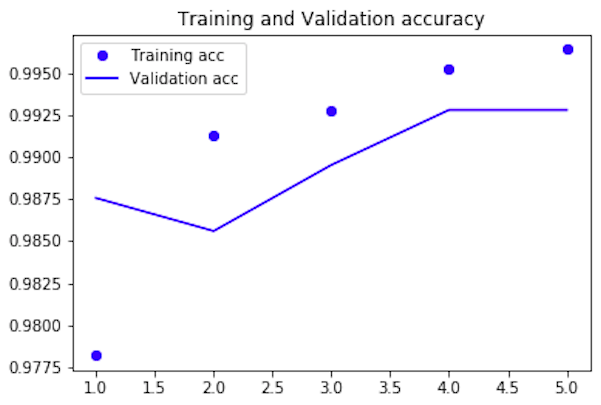
Validation_accの推移グラフです。5epoch 完了時の値は99.28%で、最終テストデータでのaccyracy(精度)は99.42%でした。ただ、今回の場合、異常データが少ないので、精度だけ見ていては不十分です。
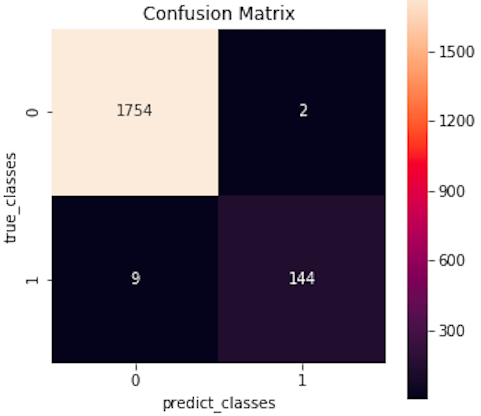
Confusion Matrix です。accuracy = (1754+144) / (1754+2+9+144) = 99.42%、precision = 144 / (144+2) = 98.6 %、Recall = 144 / (144+9) = 94.1% です。
今回のネットワークは本当に異常な人をどれくらいの精度で検出できるか、つまりRecall が重要です。結果は94.1%で、本当に異常な153人の内、144人は正しく異常と判断出来、見逃す人は9人と言う結果でした。
まあ、データ数を大幅にダイエットした中では、結構イイ感じではないでしょうか。なお、今回のデータセット作成や内容を見る部分のコードは、Preferred Networks の資料を参考にさせて頂きました。ありがとうございました。
さて、2018年ももうすぐ終わりですね。皆さん良いお年をお迎え下さい。
では、また。




コメントを残す