今回は温故知新、AutoEncoder をサクッと改造して 初歩的な異常検知をやってみたいと思います。
こんにちは cedro です。
最近、異常検知に興味があって色々やってみているわけですが、画像の異常検知の最も基本的なものと言えばオートエンコーダ ではないでしょうか。
オートエンコーダ(AutoEncoder)とは、入力画像を次元圧縮してから復元させることによって特徴量を学習し、学習後は入力画像とそっくりな画像を出力させるネットワークです。
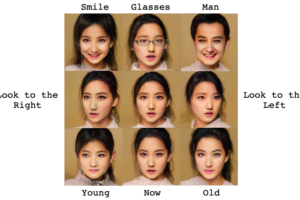
入力と同じ画像を出力するネットワークなんて意味がないように思えますが、これが異常検知に使えるんです。それから、ノイズ除去やメガネ女子のメガネを外すのにも、使えます(笑)。
ということで、今回は温故知新、AutoEncoder をサクッと改造して 初歩的な異常検知をやってみたいと思います。
まず、AutoEncoderを動かしてみます
|
1 2 3 4 5 6 7 8 9 10 11 12 13 14 15 16 17 18 19 20 21 22 23 24 25 26 27 28 29 30 31 32 33 34 35 36 37 38 39 40 41 42 43 44 45 46 47 48 49 50 51 52 53 54 55 56 57 58 |
from keras.layers import Input, Dense from keras.models import Model from keras.datasets import mnist from sklearn.model_selection import train_test_split import numpy as np import matplotlib.pyplot as plt # AutoEncoder ネットワーク構築 encoding_dim = 32 input_img = Input(shape=(784,)) encoded = Dense(encoding_dim, activation='relu')(input_img) decoded = Dense(784, activation='sigmoid')(encoded) autoencoder = Model(input=input_img, output=decoded) autoencoder.compile(optimizer='adadelta', loss='binary_crossentropy') # MNIST データ読み込み (x_train, y_train), (x_test, y_test) = mnist.load_data() # データの前準備 x_train, x_valid = train_test_split(x_train, test_size=0.175) x_train = x_train.astype('float32')/255. x_valid = x_valid.astype('float32')/255. x_test = x_test.astype('float32')/255. x_train = x_train.reshape((len(x_train), np.prod(x_train.shape[1:]))) x_valid = x_valid.reshape((len(x_valid), np.prod(x_valid.shape[1:]))) x_test = x_test.reshape((len(x_test), np.prod(x_test.shape[1:]))) # 学習 autoencoder.fit(x_train, x_train, nb_epoch=50, batch_size=256, shuffle=True, validation_data=(x_valid, x_valid)) # 出力画像の取得 decoded_imgs = autoencoder.predict(x_test) # サンプル画像表示 n = 6 plt.figure(figsize=(12, 4)) for i in range(n): # テスト画像を表示 ax = plt.subplot(2, n, i+1) plt.imshow(x_test[i].reshape(28, 28)) plt.gray() ax.get_xaxis().set_visible(False) ax.get_yaxis().set_visible(False) # 出力画像を表示 ax = plt.subplot(2, n, i+1+n) plt.imshow(decoded_imgs[i].reshape(28, 28)) plt.gray() ax.get_xaxis().set_visible(False) ax.get_yaxis().set_visible(False) plt.savefig("result.png") plt.show() |
シンプルなオートエンコーダのコードです。MNIST(数字の1〜9)のデータセットを学習し、学習後は入力に1〜9の数字を入れると、それとそっくりな1〜9の数字を出力します。
ネットワークは、入力28×28=784次元を30次元に次元圧縮してから元の28×28=784次元に戻すものです。入力画像と同じ画像を出力させるように学習をさせると、30次元のところで、1〜9の数字の特徴量を重みとして学習するわけです。

学習後にテスト画像を入力した結果です。上段がテスト画像、下段が出力画像です。結構忠実に再現出来るものですね。
さて、学習したことがあるものは再現出来るということは、逆に言うと学習したことがないものは再現出来ないわけです。この性質を利用すると異常検知が出来ることは何となく分かると思います。
それでは、正常画像を「1」、異常画像を「9」として、試してみましょう。
|
1 2 3 4 5 6 7 8 9 10 11 12 13 14 15 16 17 |
# 学習データを「1」のみにする x1 =[] for i in range(len(x_train)): if y_train[i] == 1 : x1.append(x_train[i]) x_train = np.array(x1) # テストデータを「1」と「9」にする x2, y = [],[] for i in range(len(x_test)): if y_test[i] == 1 or y_test[i] == 9 : x2.append(x_test[i]) y.append(y_test[i]) x_test = np.array(x2) y = np.array(y) |
学習データは「1」のみ、テストデータは「1」と「9」にするために、♯ MNIST データ読み込み の直後に、このコードを追加します。
なお、データ数が少なくなるので、epoch = 50 → epoch = 300 にしています。これで、コードを実行すると、

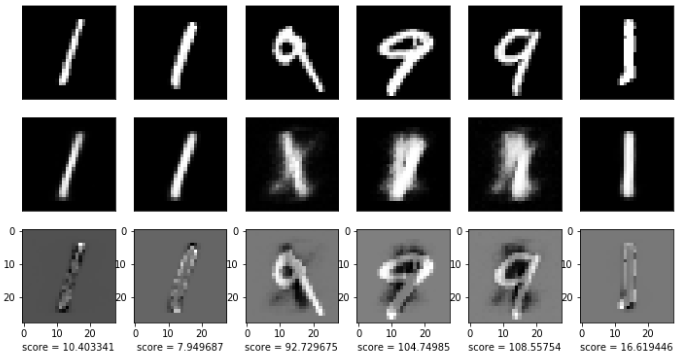
正常画像「1」はそっくりに再現出来ますが、異常画像「9」は全く再現出来ていません。この違いを定量化するために、テスト画像と出力画像の差を計算してみましょう。
|
1 2 3 4 5 6 7 8 9 10 11 12 13 14 15 16 17 18 19 20 21 22 23 24 25 26 27 28 29 30 31 32 33 34 35 36 37 |
# サンプル画像表示 n = 6 plt.figure(figsize=(12, 6)) for i in range(n): # テスト画像を表示 ax = plt.subplot(3, n, i+1) plt.imshow(x_test[i].reshape(28, 28)) plt.gray() ax.get_xaxis().set_visible(False) ax.get_yaxis().set_visible(False) # 出力画像を表示 ax = plt.subplot(3, n, i+1+n) plt.imshow(decoded_imgs[i].reshape(28, 28)) plt.gray() ax.get_xaxis().set_visible(False) ax.get_yaxis().set_visible(False) # 入出力の差分画像を計算 diff_img = x_test[i] - decoded_imgs[i] # 入出力の差分数値を計算 diff = np.sum(np.abs(x_test[i]-decoded_imgs[i])) # 差分画像と差分数値の表示 ax = plt.subplot(3, n, i+1+n*2) plt.imshow(diff_img.reshape(28, 28)) plt.gray() ax.get_xaxis().set_visible(True) ax.get_yaxis().set_visible(True) ax.set_xlabel('score = '+str(diff)) plt.savefig("result.png") plt.show() plt.close() |
入出力の差分画像と差分数値を表示するコードです。♯ サンプル画像表示 のコードの一部を修正・追加しています。
入出力の差分画像は、21行目の diff_img = x_test [ i ] – decoded_imgs [ i ] で、単純に 入力画像ー出力画像で計算しています。
入出力の差分数値は、24行目の diff = np.sum ( np.abs ( x_test [ i ] – decoded_imgs [ i ] )) で、各要素(784個)について入力から出力の引き算をし、その絶対値の総和をとって計算しています。
そして 27-36行目で、差分画像を表示し、その画像の下に差分数値( score)を表示します。
それでは、これで実行してみます。

テスト画像が正常の「1」の場合は、差分画像が全体的に黒っぽくscore は低い値です。逆に、テスト画像が異常の「9」の場合は、差分画像に白っぽい部分が出て来てscore は高い値になります。
では、どれくらいの精度で異常検知が出来そうかをヒストグラムでみてみましょう。
|
1 2 3 4 5 6 7 8 9 10 11 12 13 14 15 16 17 18 19 20 21 22 23 24 25 26 27 28 29 30 31 32 33 34 35 36 37 38 39 40 41 42 43 44 45 46 |
# score を記録したファイルがあれば一端クリア import os if os.path.exists('scores_1.txt'): os.remove('scores_1.txt') if os.path.exists('scores_9.txt'): os.remove('scores_9.txt') # score の計算、結果のファイル保存 for i in range(100): score = np.sum(np.abs(x_test[i]-decoded_imgs[i])) if y[i] == 1: with open('scores_1.txt','a') as f: f.write(str(score)+'\n') else: with open('scores_9.txt','a') as f: f.write(str(score)+'\n') # ファイルを元にヒストグラムの表示 import matplotlib.pyplot as plt import csv x =[] with open('scores_1.txt', 'r') as f: reader = csv.reader(f) for row in reader: row = int(float(row[0])) x.append(row) y =[] with open('scores_9.txt', 'r') as f: reader = csv.reader(f) for row in reader: row = int(float(row[0])) y.append(row) plt.title("Score Histgram") plt.xlabel("Score") plt.ylabel("freq") plt.hist(x, bins=10, alpha=0.3, histtype='stepfilled', color='r', label="1") plt.hist(y, bins=40, alpha=0.3, histtype='stepfilled', color='b', label='9') plt.legend(loc=1) plt.savefig("histgram.png") plt.show() plt.close() |
テスト画像が「1」の場合と「9」の場合のスコア・ヒストグラムを重ね描きするコードです。このコードを最後に追加して、実行してみます。

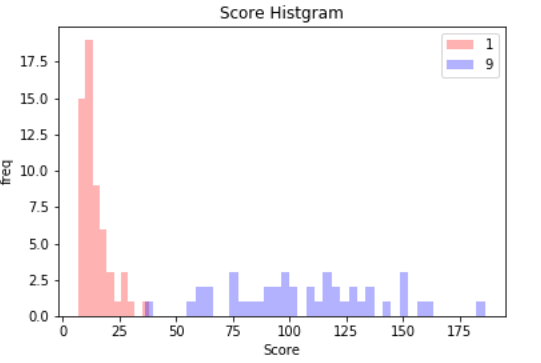
テスト画像(n=100)が、「1」の場合のスコア・ヒストグラムを赤色、「9」の場合のスコア・ヒストグラムを青色で表示しています。これを見ると、適切な閾値を設定すれば、かなりの精度(98%くらい)で異常検知が出来そうです。
これだけみると、オートエンコーダだけで何でも出来そうですが、これはMNISTという黒字に白で数字を描いた単純なデータセットだから可能なだけで、ちょっと複雑なデータセットになるとこうは行きません。
最後に最終的なコード全体を載せておきます。
では、また。
|
1 2 3 4 5 6 7 8 9 10 11 12 13 14 15 16 17 18 19 20 21 22 23 24 25 26 27 28 29 30 31 32 33 34 35 36 37 38 39 40 41 42 43 44 45 46 47 48 49 50 51 52 53 54 55 56 57 58 59 60 61 62 63 64 65 66 67 68 69 70 71 72 73 74 75 76 77 78 79 80 81 82 83 84 85 86 87 88 89 90 91 92 93 94 95 96 97 98 99 100 101 102 103 104 105 106 107 108 109 110 111 112 113 114 115 116 117 118 119 120 121 122 123 124 125 126 127 128 129 130 131 132 133 134 135 |
from keras.layers import Input, Dense from keras.models import Model from keras.datasets import mnist from sklearn.model_selection import train_test_split import numpy as np import matplotlib.pyplot as plt # AutoEncoder ネットワーク構築 encoding_dim = 32 input_img = Input(shape=(784,)) encoded = Dense(encoding_dim, activation='relu')(input_img) decoded = Dense(784, activation='sigmoid')(encoded) autoencoder = Model(input=input_img, output=decoded) autoencoder.compile(optimizer='adadelta', loss='binary_crossentropy') # MNIST データ読み込み (x_train, y_train), (x_test, y_test) = mnist.load_data() # 学習データを「1」のみにする x1 =[] for i in range(len(x_train)): if y_train[i] == 1 : x1.append(x_train[i]) x_train = np.array(x1) # テストデータを「1」と「9」にする x2, y = [],[] for i in range(len(x_test)): if y_test[i] == 1 or y_test[i] == 9 : x2.append(x_test[i]) y.append(y_test[i]) x_test = np.array(x2) y = np.array(y) # データの前準備 x_train, x_valid = train_test_split(x_train, test_size=0.175) x_train = x_train.astype('float32')/255. x_valid = x_valid.astype('float32')/255. x_test = x_test.astype('float32')/255. x_train = x_train.reshape((len(x_train), np.prod(x_train.shape[1:]))) x_valid = x_valid.reshape((len(x_valid), np.prod(x_valid.shape[1:]))) x_test = x_test.reshape((len(x_test), np.prod(x_test.shape[1:]))) # 学習 autoencoder.fit(x_train, x_train, nb_epoch=300, batch_size=256, shuffle=True, validation_data=(x_valid, x_valid)) # テスト画像を変換 decoded_imgs = autoencoder.predict(x_test) # サンプル画像表示 n = 6 plt.figure(figsize=(12, 6)) for i in range(n): # テスト画像を表示 ax = plt.subplot(3, n, i+1) plt.imshow(x_test[i].reshape(28, 28)) plt.gray() ax.get_xaxis().set_visible(False) ax.get_yaxis().set_visible(False) # 出力画像を表示 ax = plt.subplot(3, n, i+1+n) plt.imshow(decoded_imgs[i].reshape(28, 28)) plt.gray() ax.get_xaxis().set_visible(False) ax.get_yaxis().set_visible(False) # 入出力の差分画像を計算 diff_img = x_test[i] - decoded_imgs[i] # 入出力の差分数値を計算 diff = np.sum(np.abs(x_test[i]-decoded_imgs[i])) # 差分画像と差分数値の表示 ax = plt.subplot(3, n, i+1+n*2) plt.imshow(diff_img.reshape(28, 28)) plt.gray() ax.get_xaxis().set_visible(True) ax.get_yaxis().set_visible(True) ax.set_xlabel('score = '+str(diff)) plt.savefig("result.png") plt.show() plt.close() # score を記録したファイルがあれば一端クリア import os if os.path.exists('scores_1.txt'): os.remove('scores_1.txt') if os.path.exists('scores_9.txt'): os.remove('scores_9.txt') # score の計算、結果のファイル保存 for i in range(100): score = np.sum(np.abs(x_test[i]-decoded_imgs[i])) if y[i] == 1: with open('scores_1.txt','a') as f: f.write(str(score)+'\n') else: with open('scores_9.txt','a') as f: f.write(str(score)+'\n') # ファイルを元にヒストグラムの表示 import matplotlib.pyplot as plt import csv x =[] with open('scores_1.txt', 'r') as f: reader = csv.reader(f) for row in reader: row = int(float(row[0])) x.append(row) y =[] with open('scores_9.txt', 'r') as f: reader = csv.reader(f) for row in reader: row = int(float(row[0])) y.append(row) plt.title("Score Histgram") plt.xlabel("Score") plt.ylabel("freq") plt.hist(x, bins=10, alpha=0.3, histtype='stepfilled', color='r', label="1") plt.hist(y, bins=40, alpha=0.3, histtype='stepfilled', color='b', label='9') plt.legend(loc=1) plt.savefig("histgram.png") plt.show() plt.close() |
2021.6.8 google colab版を追加しました。
Tensorflowがバージョンアップされ、一部コードの書き方が変更になったためエラーが発生します。それを受けて、google colab 版を追加します。下記リンクでを開いたら中央上部に表示される「Open in Colab」をクリックして下さい。
リンク : https://github.com/cedro3/others2/blob/main/autoencoder.ipynb


お世話になります。
kerasやtensorflow をインストールした時から、
tensorflow\keras\datasets\mnist まで存在しますが、その中に、load_data() なるものがありません。
上記のコードでは、データセット「mnist」がどのディレクトリの中にあればよいのでしょうか?
ダウンロードのやり方を教えて下さい。
kkanoさん、コメントありがとうございます。
Tensorflowが2.0にアップグレードされ、コードの書き方が一部変更になりエラーが出るようです。
そのため、google colab のノートブック版を作成しましたので、下記リンクでお試し下さい。開いたら中央上部に表示される「Open in Colab」をクリックして下さい。
リンク: https://github.com/cedro3/others2/blob/main/autoencoder.ipynb
大変わかりやすく参考になりました!
ありがとうございます。
掲載いただいているサンプルコードを実行したところ、less=0.68程度となり、うまく画像が再現できませんでした。
最適化関数をadamdeltaからadamに変更したところ、less=0.09程度にまで向上し、画像が再現できるようになりました。
変更前:autoencoder.compile(optimizer=’adamdelta’, loss=’binary_crossentropy’)
変更後:autoencoder.compile(optimizer=’adam’, loss=’binary_crossentropy’)
参考にしてみたサイト
https://blog.keras.io/building-autoencoders-in-keras.html
【補足】
tensorflowの仕様変更?のため
サンプルコードは下記のとおりに微修正してkeras ver.2.4.3で実行しています。
・input -> inputs
・output -> outputs
・nb_epoch -> epochs
nakapooさん
アップデート情報ありがとうございます。助かります! ^^