今回は 日本語くずし字データセット KMNISTを使ってサクッと遊んでみたいと思います。
こんにちは cedro です。
最近、人文学オープンデータ共同利用センターは、KMNIST という日本語くずし字データセットが発表しました。データセットは3種類あり、Kuzushiji-MNIST(ひらがな10文字)、Kuzushiji-49(ひらがな49文字)、Kuzushiji-Kanji(漢字3832文字)です。
特に、Kuzushiji-MNIST は日本語くずし字というかなりニッチな領域のデータを、あのデータセットのスタンダード MNISTと完全互換の仕様に仕上げたという、意欲的なデータセットです。
ということで、今回は 日本語くずし字データセット KMNISTを使ってサクッと遊んでみたいと思います。
データセットをダウンロードする
GithubからフォルダーをCloneするかDownloadZIPします。フォルダーの中の download_data.py を動かすとデータセットを簡単にダウンロード出来ます。

download_data.py を動かした時の画面です。こんな風に、数字を選択するだけで好みのデータセットをダウンロードできます。
1) Kuzushuji-MNIST を 2)NumPy data format (.npz) でダウンロードし k フォルダーを作って保管します。
|
1 2 3 4 5 6 7 8 9 10 11 12 13 14 15 16 17 18 19 20 |
import numpy as np import matplotlib.pyplot as plt x_train = np.load('k/kmnist-train-imgs.npz')['arr_0'] x_test = np.load('k/kmnist-test-imgs.npz')['arr_0'] y_train = np.load('k/kmnist-train-labels.npz')['arr_0'] y_test = np.load('k/kmnist-test-labels.npz')['arr_0'] print(x_train.shape, x_test.shape, y_train.shape, y_test.shape) fig,axes = plt.subplots(nrows=10, ncols=10, figsize=(12, 12)) for r in range(10): data = x_train[y_train==r] for c in range(10): axes[r, c].axis("off") axes[r, c].imshow(data[c], cmap='Greys_r') plt.savefig('kmnist.png') plt.show() |
kmnist のデータセットの中身を見るコードです。フォルダーの中で、このコードを実行します。
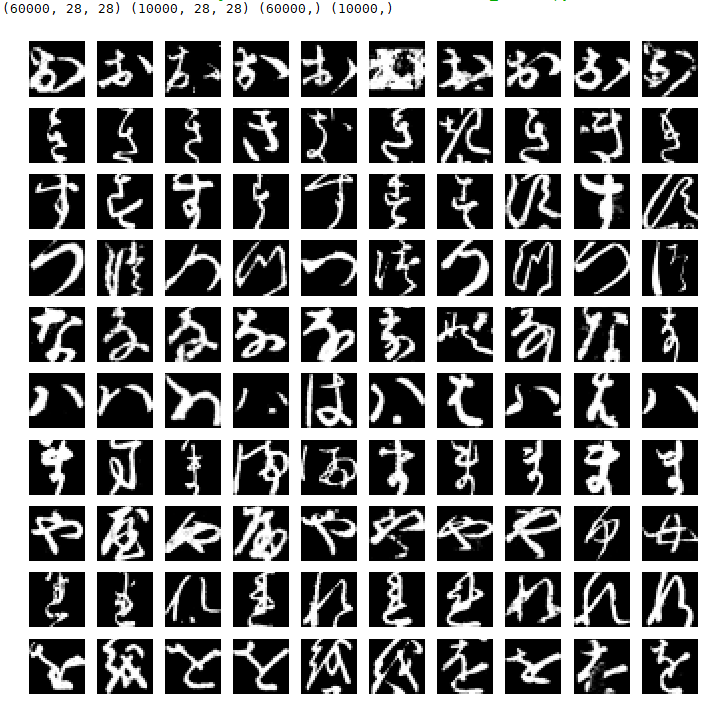
コードの実行結果です。x_trainのシェイプは(60000, 28, 28)、x_testのシェイプは(10000, 28, 28) とMNISTと全く同じです。文字は、ひらがの中から「お、き、す、つ、な、は、ま、や、れ、を」の10文字を選んでいます。さすが、くずし字、全く読めないような文字も混ざっています(笑)。
変分オートエンコーダーで使ってみる
CNNを使った分類は既に色々な方々がやっているので、今回は変分オートエンコーダで kmnist のデータセットを使ってみます。今回、流用するのは、このコードです。
|
1 2 3 4 5 6 7 8 |
# MNIST dataset #(x_train, y_train), (x_test, y_test) = mnist.load_data() x_train = np.load('k/kmnist-train-imgs.npz')['arr_0'] x_test = np.load('k/kmnist-test-imgs.npz')['arr_0'] y_train = np.load('k/kmnist-train-labels.npz')['arr_0'] y_test = np.load('k/kmnist-test-labels.npz')['arr_0'] |
コードはデータセットの読み込み部分を、上記の様に変更するだけです。
注意点は、pydot と graphviz をインストールしてない場合は、ImportError: Failed to import pydot. You must install pydot and graphviz for pydotprint to work. というエラーになりますので、インストールするか、147行目・157行目・190-192行目の plot_model (モデルを図示するコマンド)をコメントアウトして下さい。
また、keras と tensorflow のバージョンによっては、 TypeError: compile() missing 1 required positional argument: ‘loss’ というエラーが出る場合がありますので、この場合は vae.compile(optimizer=’adam’) → vae.compile(optimizer=’adam’, loss = ”) に変更して下さい。
さて、コードを実行します。vae_mlp ですので、ノートブックでサクサク動きます。私のMacbookAir では15sec/epochくらいで、 50epoch が13分弱で完了します。
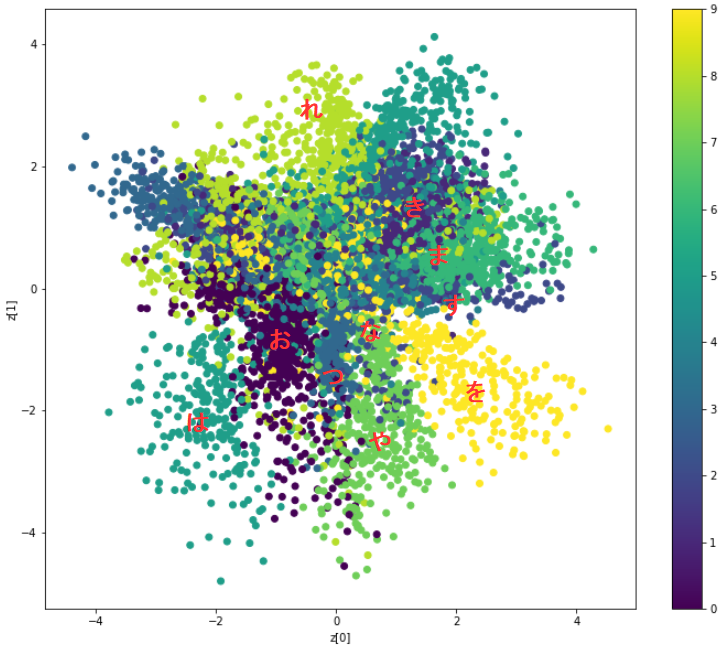
2次元マップに文字データのラベルをマッピングした結果です。まずまず、上手く分布しているようです。なお、赤色の文字は、後で追加したもので、参考です。
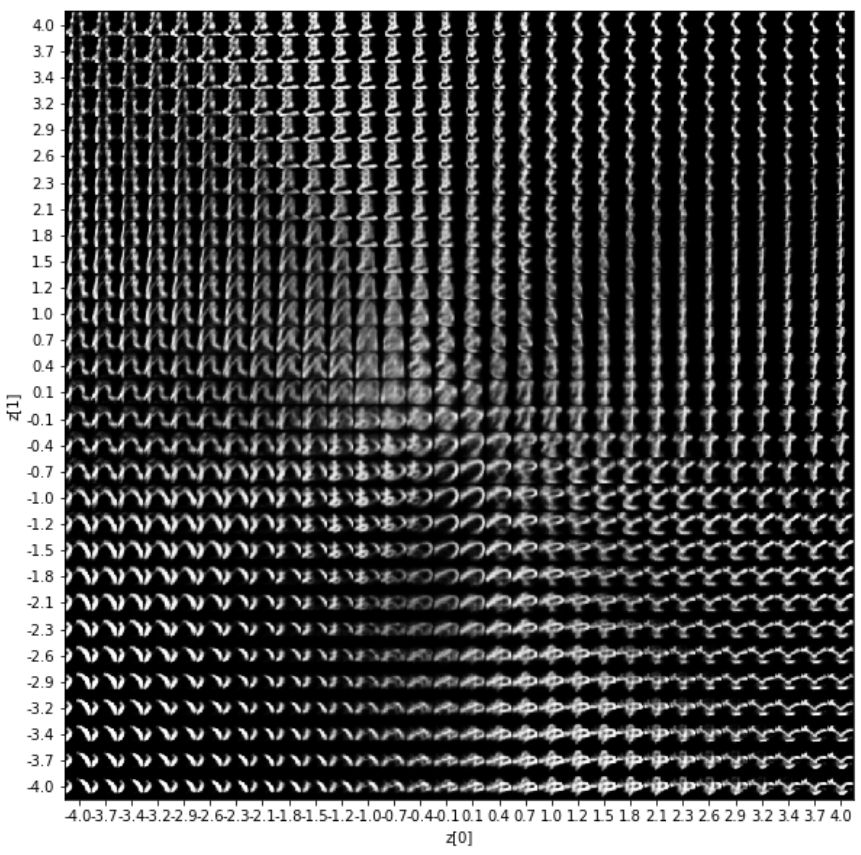
2次元マップに画像をマッピングした結果です。中心部は色々な文字が連続的に変化していますが、周辺部は結構固定的なイメージです。
それでは、2次元マップの中心部のデータ(トロ身の部分)を使って、KMNISTのモーフィング動画(gif動画)を自動で作ってみます。
|
1 2 3 4 5 6 7 8 9 10 11 12 13 14 15 16 17 18 19 20 21 22 23 24 25 26 |
# 半径 r の円周上の画像を n個取得 r = 2 n = 100 x1 = np.linspace(-np.pi, np.pi, n) y1 = np.linspace(-np.pi, np.pi, n) x = r*np.cos(x1) y = r*np.sin(y1) for i in range(len(x)): z_sample = np.array([[x[i], y[i]]]) x_decoded = decoder.predict(z_sample) digit = x_decoded[0].reshape(28, 28) plt.imshow(digit, cmap='Greys_r') plt.savefig("fig/"+"{0:04d}".format(i)+'fig.png') print(i) # n個の画像からGIF動画を作成する from PIL import Image import glob files = sorted(glob.glob('fig/*.png')) images = list(map(lambda file: Image.open(file), files)) images[0].save('kmnist.gif', save_all=True, append_images=images[1:], duration=100, loop=0) |
このコードを♯ MNIST dataset の直前に追加します。それから、fig フォルダーを作成します。
6-9行目で中心(0, 0) 半径2の円周上のx, y座標を100ペア取得し、11-17行目でそのデータを元に2次元マップから画像を生成し、先程作成した figフォルダーに保存します
20-25行目で figフォルダー内の画像を元に gif動画を作成し ‘kmnist.gif’ で保存します。なお、duration は1枚当たりの表示時間で単位は1/1000秒、loop = 0 で無限ループの設定です。
さて、既に先程の学習結果が重みファイル(vae_mlp_mnist.h5)として保存されていますので、今度は重みファイルを読みこんで実行すれば、新たに学習する必要はなく直ぐ完了します。
python variational_autoencoder.py -w vae_mlp_mnist.h5 という感じで、通常の実行コマンドに、 -w 重みファイル名 のオプションを付けて実行します。
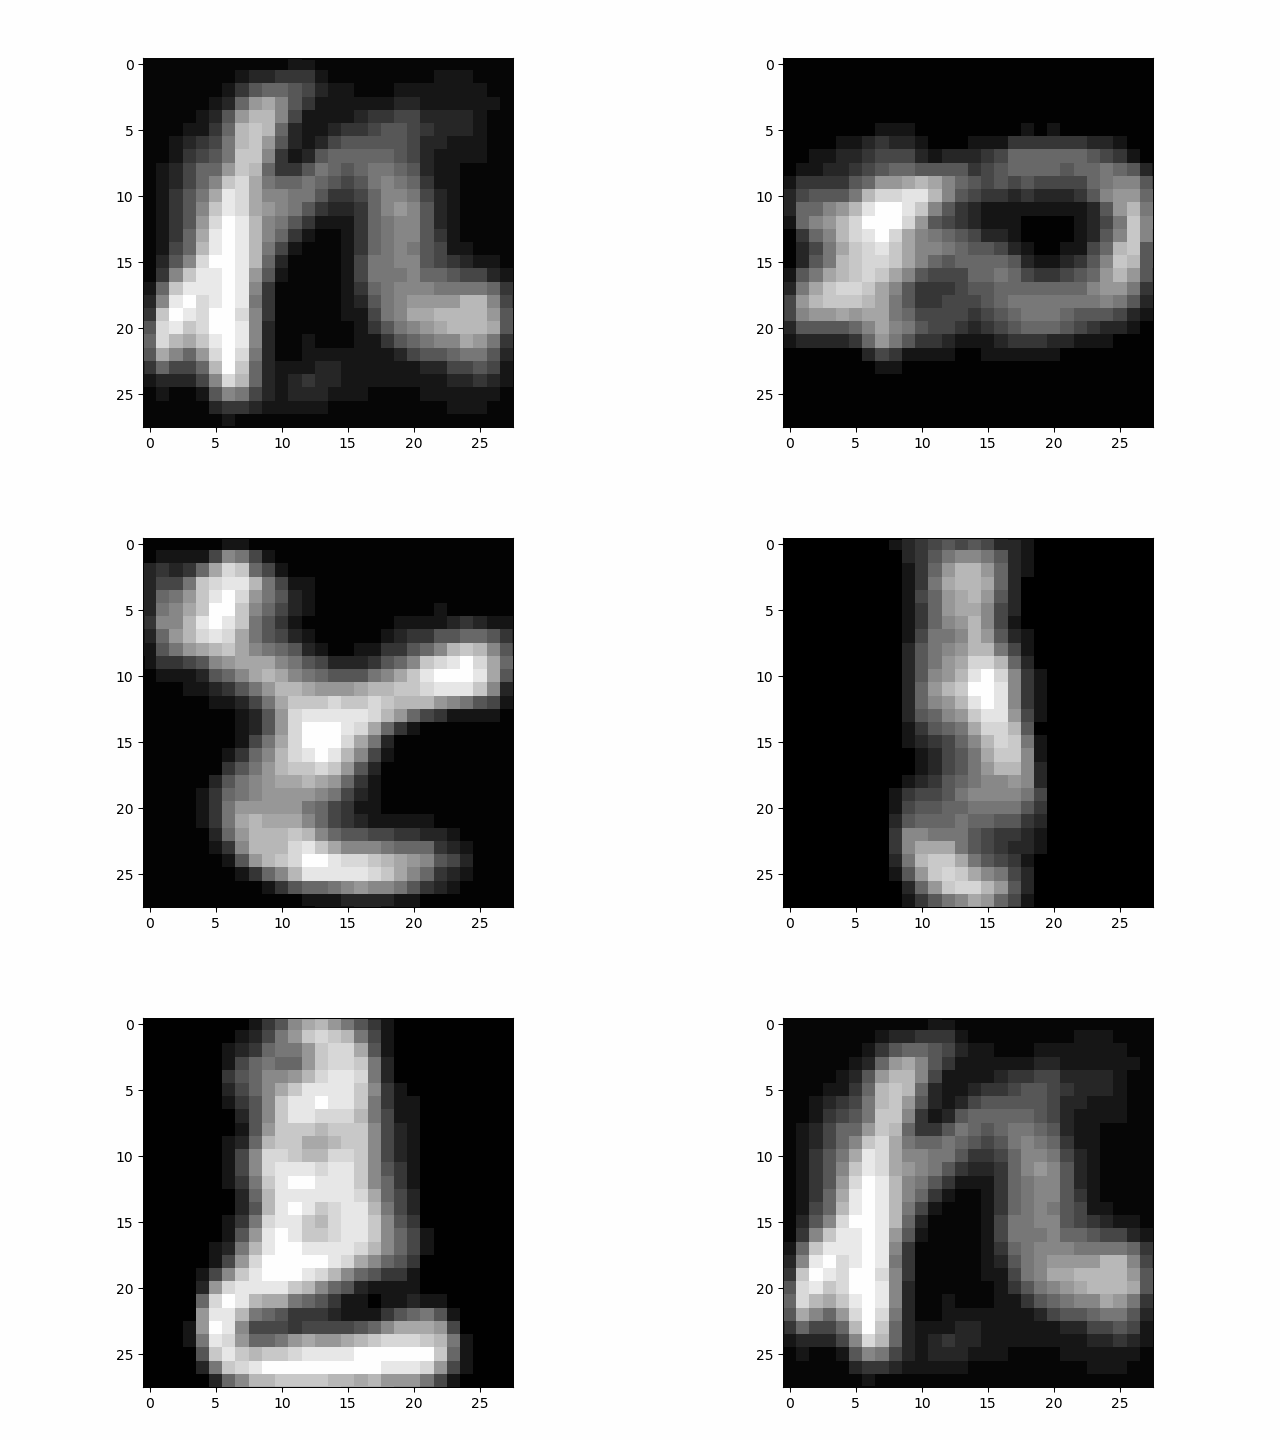
kmnist.gif の画像です。くずし字がダンスしてます(笑)。r の値を変更させると変化が変わります。
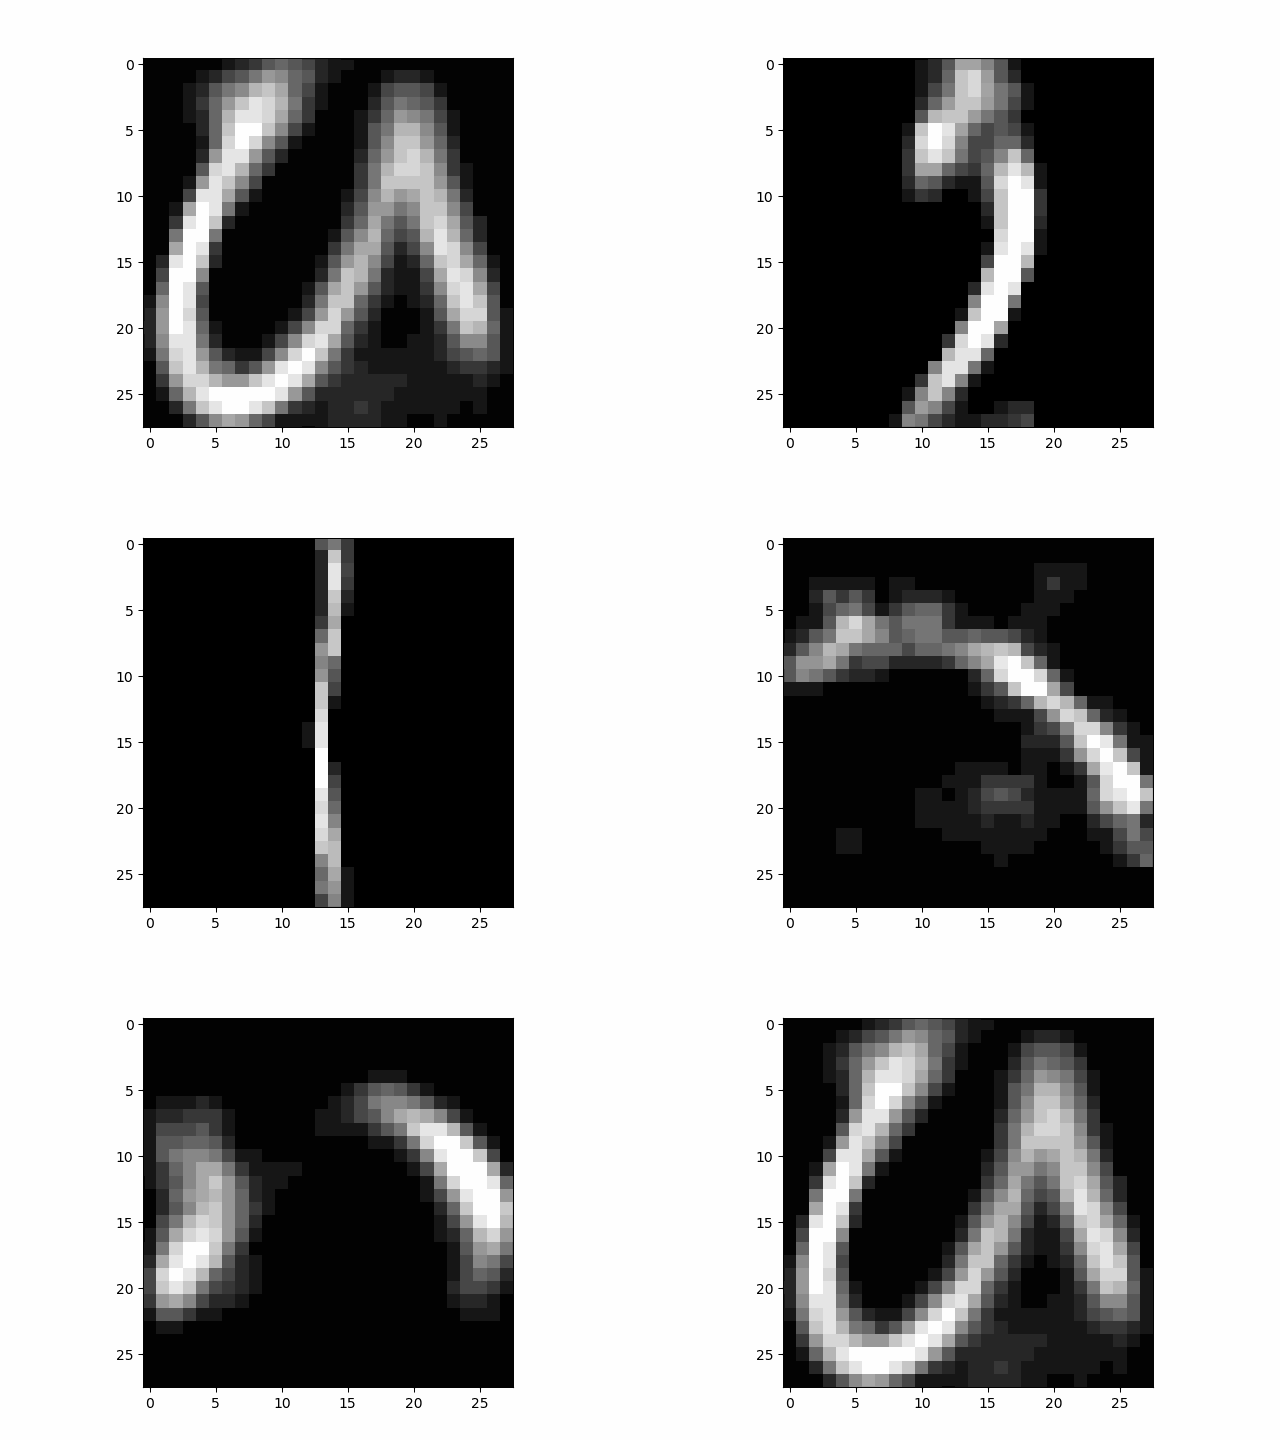
せっかくなので、Kuzushiji-49でもやってみました。設定は r =4 です。
ひらがな49文字をVAEすると相当表現力が上るのかと思ったのですが、さすがにそれは無理でした(笑)。たぶん、2次元マップに写像する時に、文字同士で領土の取り合いをするのでしょうが、弱い文字は強い文字に消されてしまうようです。
いやーそれにしても、人文学オープンデータ共同利用センターは意欲的なデータセットを作ったものです。Twitterでも話題になっていましたね。
最後に、KMNISTの改造したコードの全体を載せておきます。
では、また。
|
1 2 3 4 5 6 7 8 9 10 11 12 13 14 15 16 17 18 19 20 21 22 23 24 25 26 27 28 29 30 31 32 33 34 35 36 37 38 39 40 41 42 43 44 45 46 47 48 49 50 51 52 53 54 55 56 57 58 59 60 61 62 63 64 65 66 67 68 69 70 71 72 73 74 75 76 77 78 79 80 81 82 83 84 85 86 87 88 89 90 91 92 93 94 95 96 97 98 99 100 101 102 103 104 105 106 107 108 109 110 111 112 113 114 115 116 117 118 119 120 121 122 123 124 125 126 127 128 129 130 131 132 133 134 135 136 137 138 139 140 141 142 143 144 145 146 147 148 149 150 151 152 153 154 155 156 157 158 159 160 161 162 163 164 165 166 167 168 169 170 171 172 173 174 175 176 177 178 179 180 181 182 183 184 185 186 187 188 189 190 191 192 193 194 195 196 197 198 199 200 201 202 203 204 205 206 207 208 209 210 211 212 213 214 215 216 217 218 219 220 221 222 223 224 225 226 227 228 229 230 231 232 233 234 |
'''Example of VAE on MNIST dataset using MLP The VAE has a modular design. The encoder, decoder and VAE are 3 models that share weights. After training the VAE model, the encoder can be used to generate latent vectors. The decoder can be used to generate MNIST digits by sampling the latent vector from a Gaussian distribution with mean=0 and std=1. # Reference [1] Kingma, Diederik P., and Max Welling. "Auto-encoding variational bayes." https://arxiv.org/abs/1312.6114 ''' from __future__ import absolute_import from __future__ import division from __future__ import print_function from keras.layers import Lambda, Input, Dense from keras.models import Model from keras.datasets import mnist from keras.losses import mse, binary_crossentropy from keras.utils import plot_model from keras import backend as K import numpy as np import matplotlib.pyplot as plt import argparse import os # reparameterization trick # instead of sampling from Q(z|X), sample eps = N(0,I) # z = z_mean + sqrt(var)*eps def sampling(args): """Reparameterization trick by sampling fr an isotropic unit Gaussian. # Arguments: args (tensor): mean and log of variance of Q(z|X) # Returns: z (tensor): sampled latent vector """ z_mean, z_log_var = args batch = K.shape(z_mean)[0] dim = K.int_shape(z_mean)[1] # by default, random_normal has mean=0 and std=1.0 epsilon = K.random_normal(shape=(batch, dim)) return z_mean + K.exp(0.5 * z_log_var) * epsilon def plot_results(models, data, batch_size=128, model_name="vae_mnist"): """Plots labels and MNIST digits as function of 2-dim latent vector # Arguments: models (tuple): encoder and decoder models data (tuple): test data and label batch_size (int): prediction batch size model_name (string): which model is using this function """ encoder, decoder = models x_test, y_test = data os.makedirs(model_name, exist_ok=True) filename = os.path.join(model_name, "vae_mean.png") # display a 2D plot of the digit classes in the latent space z_mean, _, _ = encoder.predict(x_test, batch_size=batch_size) plt.figure(figsize=(12, 10)) plt.scatter(z_mean[:, 0], z_mean[:, 1], c=y_test) plt.colorbar() plt.xlabel("z[0]") plt.ylabel("z[1]") plt.savefig(filename) plt.show() filename = os.path.join(model_name, "digits_over_latent.png") # display a 30x30 2D manifold of digits n = 30 digit_size = 28 figure = np.zeros((digit_size * n, digit_size * n)) # linearly spaced coordinates corresponding to the 2D plot # of digit classes in the latent space grid_x = np.linspace(-4, 4, n) grid_y = np.linspace(-4, 4, n)[::-1] for i, yi in enumerate(grid_y): for j, xi in enumerate(grid_x): z_sample = np.array([[xi, yi]]) x_decoded = decoder.predict(z_sample) digit = x_decoded[0].reshape(digit_size, digit_size) figure[i * digit_size: (i + 1) * digit_size, j * digit_size: (j + 1) * digit_size] = digit plt.figure(figsize=(10, 10)) start_range = digit_size // 2 end_range = n * digit_size + start_range + 1 pixel_range = np.arange(start_range, end_range, digit_size) sample_range_x = np.round(grid_x, 1) sample_range_y = np.round(grid_y, 1) plt.xticks(pixel_range, sample_range_x) plt.yticks(pixel_range, sample_range_y) plt.xlabel("z[0]") plt.ylabel("z[1]") plt.imshow(figure, cmap='Greys_r') plt.savefig(filename) plt.show() # 半径 r の円周上の画像を n個取得 r = 2 n = 100 x1 = np.linspace(-np.pi, np.pi, n) y1 = np.linspace(-np.pi, np.pi, n) x = r*np.cos(x1) y = r*np.sin(y1) for i in range(len(x)): z_sample = np.array([[x[i], y[i]]]) x_decoded = decoder.predict(z_sample) digit = x_decoded[0].reshape(28, 28) plt.imshow(digit, cmap='Greys_r') plt.savefig("fig/"+"{0:04d}".format(i)+'fig.png') print(i) # n個の画像からGIF動画を作成する from PIL import Image import glob files = sorted(glob.glob('fig/*.png')) images = list(map(lambda file: Image.open(file), files)) images[0].save('kmnist.gif', save_all=True, append_images=images[1:], duration=100, loop=0) # MNIST dataset #(x_train, y_train), (x_test, y_test) = mnist.load_data() x_train = np.load('k/kmnist-train-imgs.npz')['arr_0'] x_test = np.load('k/kmnist-test-imgs.npz')['arr_0'] y_train = np.load('k/kmnist-train-labels.npz')['arr_0'] y_test = np.load('k/kmnist-test-labels.npz')['arr_0'] image_size = x_train.shape[1] original_dim = image_size * image_size x_train = np.reshape(x_train, [-1, original_dim]) x_test = np.reshape(x_test, [-1, original_dim]) x_train = x_train.astype('float32') / 255 x_test = x_test.astype('float32') / 255 # network parameters input_shape = (original_dim, ) intermediate_dim = 512 batch_size = 128 latent_dim = 2 epochs = 50 # VAE model = encoder + decoder # build encoder model inputs = Input(shape=input_shape, name='encoder_input') x = Dense(intermediate_dim, activation='relu')(inputs) z_mean = Dense(latent_dim, name='z_mean')(x) z_log_var = Dense(latent_dim, name='z_log_var')(x) # use reparameterization trick to push the sampling out as input # note that "output_shape" isn't necessary with the TensorFlow backend z = Lambda(sampling, output_shape=(latent_dim,), name='z')([z_mean, z_log_var]) # instantiate encoder model encoder = Model(inputs, [z_mean, z_log_var, z], name='encoder') encoder.summary() #plot_model(encoder, to_file='vae_mlp_encoder.png', show_shapes=True) # build decoder model latent_inputs = Input(shape=(latent_dim,), name='z_sampling') x = Dense(intermediate_dim, activation='relu')(latent_inputs) outputs = Dense(original_dim, activation='sigmoid')(x) # instantiate decoder model decoder = Model(latent_inputs, outputs, name='decoder') decoder.summary() #plot_model(decoder, to_file='vae_mlp_decoder.png', show_shapes=True) # instantiate VAE model outputs = decoder(encoder(inputs)[2]) vae = Model(inputs, outputs, name='vae_mlp') if __name__ == '__main__': parser = argparse.ArgumentParser() help_ = "Load h5 model trained weights" parser.add_argument("-w", "--weights", help=help_) help_ = "Use mse loss instead of binary cross entropy (default)" parser.add_argument("-m", "--mse", help=help_, action='store_true') args = parser.parse_args() models = (encoder, decoder) data = (x_test, y_test) # VAE loss = mse_loss or xent_loss + kl_loss if args.mse: reconstruction_loss = mse(inputs, outputs) else: reconstruction_loss = binary_crossentropy(inputs, outputs) reconstruction_loss *= original_dim kl_loss = 1 + z_log_var - K.square(z_mean) - K.exp(z_log_var) kl_loss = K.sum(kl_loss, axis=-1) kl_loss *= -0.5 vae_loss = K.mean(reconstruction_loss + kl_loss) vae.add_loss(vae_loss) vae.compile(optimizer='adam', loss='') ### vae.summary() #plot_model(vae, #to_file='vae_mlp.png', #show_shapes=True) if args.weights: vae.load_weights(args.weights) else: # train the autoencoder vae.fit(x_train, epochs=epochs, batch_size=batch_size, validation_data=(x_test, None)) vae.save_weights('vae_mlp_mnist.h5') plot_results(models, data, batch_size=batch_size, model_name="vae_mlp") |






コメントを残す